How to unit test, the right way

It’s important to understand not only what unit testing is, but how to implement unit tests correctly. Many developers live their lives going through the motions, scraping by — but not you. No, you’re a cut above the rest; on a quest to write unit tests that are the envy of your colleagues. Sound like you? Keep reading. Not resonating? keep reading anyway — I’m sick of cleaning up after you. πŸ™‚

Unit testing is the process of breaking up a program into components to test individually. This can save many hours of manual QA before release. With proper unit tests, you can be sure the program is still working as expected, even after sweeping code changes.

At the start, unit tests can feel like a waste of time. It’s true, doing them properly will require you to write more code, but I promise the time you’ll save in the long run far outweighs the time spent writing tests.

Defining Scope

A common dilemma when first learning: properly defining scope. It’s easy to make the tests either too broad or too specific. The guideline I found to be the most useful? Think of the test as documentation. When writing a function, it’s common to describe its inputs and expected outputs. Unit tests verify this input/output relationship. They should not care how the insides of the method work, so long as it yields the expected result.

In general, a unit test should:

  • Test only a single method
  • Provide specific arguments to the method
  • Verify the result

Let’s dive deeper into each of these points.

Testing a single method

This is exactly what it sounds like. A test should target a single method. Take a look at the following pseudo code.

def test_add():
    assertEqual(8, add(5,3))

The snippet above presents a simple test for a function called add. If we want to make the test more robust, append lines to the existing test function, do not needlessly create another test unless there is a clear difference. For instance, specific edge cases are commonly factored into their own testing method. When incorporating bug fixes, it’s also common to add a specialized test case that references the issue to safeguard against repeating past mistakes.

This is good:

def test_add():
    assertEqual(8, add(5, 3))
    assertEqual(-1, add(1, -2))
def test_mult():
    assertEquals(10, mult(5, 2))

In contrast, this is generally frowned upon:

def test_add_simple():
    assertEqual(8, add(5, 3))
def test_add_negative():
    assertEqual(-1, add(1, -2))

More than one test for a single method. As mentioned above, an exception could be made if the negative instance is addressing a specific issue in a bug tracker. In that case, a comment should be added with a link to the issue or bug id.

The below snippet is also bad… more than one method tested in a single unit test.

def test_math_functions():
    assertEquals(8, add(5, 3))
    assertEquals(-1, add(1, -2))
    assertEquals(10, mult(5, 2))

Provide specific arguments the method

Do not generate a unique argument every time the test is run. Hard coding is not only okay, but often encouraged (in this context, don’t get carried away)! It’s imperative that unit tests are deterministic. If method arguments are generated on the fly, one developer may get an error while another passes every test. Most important takeaway: testing arguments should be constant across every instance of the program. Let’s look at an example.

Suppose you have a faster way to implement len called my_len() that you want to test.

This is good:

def test_my_len():
    assertEqual(3, my_len("abc"))
    assertEqual(0, my_len([]))
    assertEqual(3, my_len([1,2,3]))

This is bad:

def test_my_len():
    l = generate_random_list()
    assertEqual(len(l), my_len(l))

Different code paths could be tested depending on the list that’s generated.

Another cannon, always use the least amount of assert statements possible for full coverage. If my_len treats “abc” and “abcd” exactly the same way internally, there is no reason to write two assert statements, just pick one. On the other hand, if the method has a specific if statement to check for a null argument, then absolutely include that.

This is good:

def test_my_len():
    assertEqual(3, my_len("abc"))
    # Check for defined edge case
    assertEqual(-1, my_len(None))

This is bad:

def test_my_len():
    assertEqual(3, my_len("abc"))
    assertEqual(4, my_len("abcd"))
    assertEqual(5, my_len("abcde"))

There’s no reason to believe “abc” would pass and “abcd” would fail. The same code path is being tested multiple times. This is wasteful.

Verify the result

Not much to say here. Like above, the result should also be deterministic. One stylistic note is worth mentioning. Most unit testing frameworks expect assertEquals(...) to have the expected result as the first argument, and the test result as the second.

assertEqual(expected, actual)

Of course, the tests will work if this is backwards, but your coworkers may scoff.

Testing for exceptions

Testing for exceptions is equally important. If the method is expected to throw an exception with certain arguments, test it! The implementation varies by language. Typically it looks something like this:

assertRaises(IllegalArgumentException, is_numeric(null))

The test case will only pass if an exception is thrown. If a different exception occurs or it returns normally, then it will fail — alerting you to the problem.

Test Driven Development

I firmly believe all projects should use unit tests. This, however, is not what test driven development is.

Test driven development refers to the practice of writing unit tests before the method implementations. It may seem backwards at first, but there are a few key advantages.

  • Start thinking about the edge cases early
  • Forces the spec to be strictly defined in advance
  • Impossible to “forget” to write those unit tests πŸ™‚

Side note: this is becoming more and more common in education. Students get instant feedback on how they’re progressing on an assignment and practice with industry methodology. Unit tests can easily be included in Jupyter Notebooks for the ultimate teaching tool.

Concrete Examples by Language

These are brief examples meant to serve as a reference.

For demonstration purposes, each illustration assumes you want to test a class called Palindrome. The class has a function called is_palindrome() that takes a single string argument and returns a boolean.

Unit Testing in Python

Python has dozens of unit testing libraries. We’re going to stick to the aptly named unittest because it’s built into Python. If you want an even simpler alternative, pytest may be worth a look.

The Palindrome class in palindrome.py.

class Palindrome():
    @staticmethod
    def is_palindrome(s):
        return s == s[::-1]

To create the unit test, start with a new file test.py.

import unittest
from palindrome import Palindrome as p

class TestPalindrome(unittest.TestCase):
    def test_is_palindrome(self):
        self.assertTrue(p.is_palindrome("racecar"))
        self.assertFalse(p.is_palindrome("thisisfalse"))
   
if __name__ == "__main__":
    unittest.main()

Simply run the test file to see the results.

$ python test.py
.
----------------------------------------------------------------------
Ran 1 test in 0.000s

OK

Unit Testing in Java

JUnit is the defacto standard in Java. First, you will need to add the JUnit dependency to the project. Here’s the quick version for Eclipse:

  1. Right click the Java project, open Project Properties
  2. Build Path > Configure Build Path
  3. Click the Libraries tab
  4. Click Add Library… on the right side
  5. Select JUnit from the list and hit next
  6. Ensure the newest version is selected in the drop down
  7. Hit Finish followed by OK

IntelliJ IDEs offer to include JUnit automatically when you start writing the test. Simply accept.

With the JUnit dependency added, create a new class called PalindromeTest. Note the special @Test annotation.

import static org.junit.jupiter.api.Assertions.assertEquals;
import org.junit.jupiter.api.Test;
// Import the class to be tested
import com.technohedge.example.Palindrome.isPalindrome;

public class PalindromeTest {
    @Test
    public void isPalindromeTest() {
        assertEquals(true, isPalindrome("racecar");
        assertEquals(false, isPalindrome("abc");
    }
}

Altman Z Score – Determining Bankruptcy Probability with QuantConnect

The Altman Z-Score is an indicator used to determine a company’s likelihood of declaring bankruptcy. A total of five ratios are necessary for the calculation. Lucky for us, they are all readily available for public companies.

The Formula

Let:
A = Working Capital / Total Assets
B = Retained Earnings / Total Assets
C = Earnings Before Interest / Total Assets
D = Market Value of Equity / Total Liabilities
E = Sales / Total Assets

Then the Altman Z Score can be calculated by:
Z = 1.2A + 1.4B + 3.3C + 0.6D + 1.0E

The relative probability of default is determined by the Z value. Specifically,

Z β‰₯ 3 β†’ Safe
1.81 ≀ Z < 3 β†’ Warning
Z < 1.81 β†’ Danger

Note that these cutoffs are from the original Altman Z Score. Different intervals have been derived for emerging markets. More information is available on Wikipedia.

Algorithm

This algorithm is heavily based on code from Aaron Gilman. It has been updated to work with new versions of QuantConnect.

It works through universe selection. Universe selection allows us to filter equities based on predefined search criteria. In this case, it selects equities that have 1) all the necessary data available for calculating the ratios and 2) a Z Score greater than 1.81. Next, the results are sorted by EBITDA and capital is equally divided among the top 100 equities. The portfolio is re-balanced on the first trading day each month.

Historic Accuracy

In Altman’s initial publication, the Altman Z Score was 72% accurate in predicting bankruptcy within two years. False negatives, however, were extremely low at just 6%. This initial accuracy has not only been proven, but actually found to be a conservative estimate. Over the years, Altman’s model was found to be 80-90% accurate — but with a higher false negative rate of around 15%.

Today, Altman’s Z Score is widely accepted. Originally designed for manufacturing companies with over $1 million in assets, it’s now used in a variety of countries and industries, though sometimes with slight modifications.

Caveats

As with most balance sheet models, the Alman Z Score should not be applied to financial companies. The balance sheets of Wallstreet companies are notoriously opaque and off-balance sheet items are numerous — making accurate calculations nearly impossible.

Jupyter Notebook: Getting Started and Installation

Jupyter Notebook provides a simple way to run code in Python, R, Scala and more. While it’s mainly used in research related fields, Jupyter can be applied to a wide variety of applications.

Jupyter is especially useful for two groups in particular. Data scientists and machine learning experts benefit from modular execution. They can load a large data set once and try many different experiments/code changes; saving an enormous amount of time in the process. Academics make up the other group. Documenting work as you go could not be easier. Professors can auto grade students work using tools like Vocareum, built to work with Jupyter.

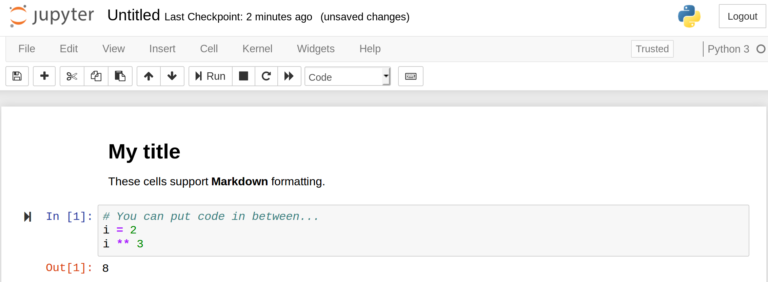
Above is a screenshot directly from a notebook. It runs in a web interface and is quite easy to use. Markdown syntax can be added to create documentation blocks — much more expressive than the brief inline comments we programmers often get used to.

Installing Jupyter Notebook

Some prefer the native installation while others like to keep everything in a self-contained Docker container. I will outline both methods — choose the one that works best for you.

Native

Jupyter Notebook is easy to install with pip. I assume you already have Python and pip installed. If that’s the case, simply run

python3 -m pip install jupyter #for Python3
python -m pip install jupyter  #for Python2

Congratulations, that’s it! To run Jupyter, simply open up a new terminal in the directory you want the notebooks to be saved. Then type:

jupyter notebook

Your default browser should automatically open to the Jupyter instance.

Docker

This guide assumes Docker is already installed. If you’re unfamiliar with Docker, please check out their guide.

Using Jupyter with Docker is easy, a container is already maintained. Simply run the container with the following command:

docker run -it -v /path/to/jupyter/directory:/work --net=host --rm jupyter/all-spark-notebook

The -v flag is used to share a local directory with Docker. /path/to/jupyter/directory should point to a local directory where you want the notebooks to be saved. When inside the Jupyter instance, be sure to save everything inside the /work directory, or it will not be saved.

Once the Docker container is launched, a unique URL will be printed to the console. Copy and paste that into a web browser and you’re good to go! You may notice the example below says 127.0.0.1 or a seemingly random string of numbers. If this is the case for you, be sure to substitute 127.0.0.1. For instance, open a web browser and go directly to the URL http://127.0.0.1:8888/?token=f19d2097c0e3455e3589c985b182b93a6c9f022612d9a2cc. Your token will be different!

Your first Jupyter project

With Jupyter successfully installed, your screen should be similar to the one pictured below.

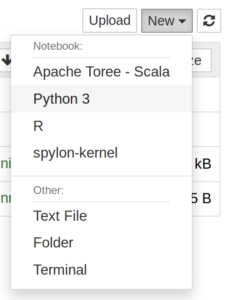
Once Jupyter Notebook is installed and launched, we can create our first actual notebook. If you installed with Docker, be sure to click on the work directory first. Then click the New dropdown, then select Python 3 (or a different language if you prefer).

All that remains is filling it with content. Each content block is a cell. There are two main types of cells: code and Markdown.

Let’s create a new code cell.

Run the code in a cell by clicking the play button with the cell selected, or by hitting ctrl + enter on the keyboard.

Now, let’s demonstrate one of the main benefits of Jupyter. Say we need to load data, which takes a lot of time. If this was a standard Python script, the data would have to be loaded during each subsequent run. This is not the case with Jupyter. We can simply put the data loading code into its own cell.

Saving & Checkpoints

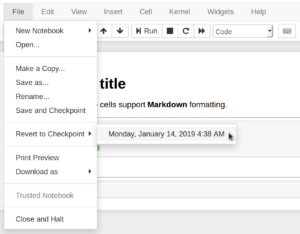
To save your work, simply click the Save & Checkpoint button.

As the name suggests, manually saving also creates a checkpoint. Checkpoints are a form of basic version control — you can easily roll back to any checkpoint later on. Work in a notebook will also be periodically auto-saved, but checkpoints must be created manually.

To share your work with someone else, simply send them the .ipynb file. They can launch the file using their own Jupyter installation and pick up right where you left off. While you can use Jupyter with a version control system (like Git of Mercurial) by checking in the .ipynb files, it’s not easy to see the individual code changes later. This is my single biggest complaint when using Jupyter. If anyone has found a solution, I would love to hear it!

A Hands-On Introduction to Machine Learning

First, let me begin by setting some expectations. This is not a guide for the hardcore ML researchers out there. This is meant to be a practical introduction to machine learning that any computer scientist can follow, without much prior knowledge of the ML domain. I feel that there are many guides that focus solely on the academics of ML, but neglect to mention how simple it is to apply towards real life applications. Even naive approaches are often surprisingly effective.

To get started, we need to install scikit and other dependencies.

pip install numpy scipy scikit-learn

For simple implementations like we’ll see today, most of the challenge revolves around data prep. Our first step is to download the JSON training data from Kaggle. If you don’t already have an account, you’ll need to create one now. Once the account is created, visit the “What’s Cooking?” competition page and select the data tab to access the downloads.

Next, we need to format the data. A CSV format will be used, with each column representing a different ingredient and each row a single recipe. In ML lingo, the ingredients are features, the data we use as a basis for the predictions. Labels, the answer to each recipe, will be generated similarly. There’s nothing too novel with the code here, just some data wrangling.

Create a file called parser.py with the following code:

1
2
3
4
5
6
7
8
9
10
11
12
13
14
15
16
17
18
19
20
21
22
23
24
25
26
27
28
29
30
31
32
33
34
35
36
37
38
39
40
41
42
43
44
45
46
47
48
49
50
51
52
53
54
55
56
57
58
59
60
61
62
63
64
65
66
67
68
69
70
71
72
73
74
75
76
77
78
79
80
81
82
83
84
85
86
87
88
#!/usr/bin/env python3

# Enable python2 compatability
from __future__ import print_function

import json

def main():
    # Define input/output file names
    train_file = "train.json"
    test_file = "test.json"
    train_file_out = "train.csv"
    test_file_out = "test.csv"
    train_file_out_labels = "train-labels.txt"
    json_data = None
    with open(train_file, 'r') as f:
        json_data = f.read()
    train_obj = json.loads(json_data)

    # Empty arrays to hold information
    labels_train = []
    labels_test = []
    # ingredients is defined as a set to prevent duplicates
    ingredients = set()

    # Generate corresponding labels and simultaneously make
    # exhaustive set of all posible cuisines (labels)
    with open(train_file_out_labels, 'w') as f:
        for recipe in train_obj:
            label = recipe["cuisine"]
            print(label, file=f)
            labels_train.append(label)
            for ingredient in recipe["ingredients"]:
                ingredients.add(ingredient)

    with open(test_file, 'r') as f:
        json_data = f.read()
    test_obj = json.loads(json_data)

    # The test file may introduce ingredients not included in training set
    # This ensures they're included
    for recipe in test_obj:
        for ingredient in recipe["ingredients"]:
            ingredients.add(ingredient)

    # Transform set to list to ensure iteration order is constant
    ingredients_list = list(ingredients)

    # Generate the CSV files
    generate_csv_for_each_recipe(ingredients_list, train_obj, train_file_out)
    generate_csv_for_each_recipe(ingredients_list, test_obj, test_file_out)

def generate_csv_for_each_recipe(ingredients_list, json_obj, output_file):
    """
    Creates an output csv file with each ingredient being a column
    and each recipe a row. 1 will represent the recipe contains the
    given ingredient if the recipe includes that incredient, else 0

    ingredients_list -- the full list of ingredients (without duplicates)
    json_obj -- the json object with recipes returned by json.loads
    output_file -- the name of the generated CSV file
    """

    # Loop thru each recipe
    with open(output_file, 'w') as f:
        for recipe in json_obj:
            rl = set()
            first = True
            s = ""
            for ingredient in recipe["ingredients"]:
                rl.add(ingredient)
            # This builds the csv row of ingredients for current recipe
            # Add 1 for ingredient if included in recipe; else 0
            for j in ingredients_list:
                # Don't prepend "," for first item
                if first != True:
                    s += ","  
                else:
                    first = False

                # Add 1 or 0 as explained above
                if j not in rl:
                    s += "0"
                else:
                    s += "1"
            print(s, file=f)

if __name__ == "__main__":
    main()

Create a new python script called train.py. Add some simple imports and variables that will prove useful later.

import numpy as np
from sklearn.linear_model import LogisticRegression
from sklearn.model_selection import train_test_split

filename = "train.csv"
label_file = "train-labels.txt"
test_file = "test.csv"
prediction_output = "predictions.txt"

Load the data files generated previously with the parser script.

# Load the training features into a np array
features = np.loadtxt(filename, delimiter=',', dtype=np.uint8)
# Load the labels
with open(label_file) as f:
    labels = f.readlines()
# Strip any new line characters or extra spaces
labels = [x.strip() for x in labels]
# Convert to np array
labels = np.asarray(labels)

The next step is to split the training data into a training set and a testing set. This will allow us to estimate how well the classifier does on the “real” test data. Think about it, the testing data from Kaggle does not include the answers (labels). To have an easy way to see how well we’re doing, it’s necessary to split the data we do have answers for. It is not okay to test with the same features used in training — the accuracy will be artificially high. Scikit includes a handy feature to split the data for us.

# Split data up into training and test data
X_train, X_test, y_train, y_test = train_test_split(features, labels)

Instantiate and train the classifier with the split data set created from the last step. Selecting the best classifier is beyond the scope of this article, so we’ll just use the Logistic Regression classifier in this example, which performs pretty well. Scikit has an example testing different classifiers, if you want to explore.

print("Starting training...")
clf = LogisticRegression()
clf.fit(X_train, y_train)
score = clf.score(X_test, y_test)
print("Model has accuracy of " + str(score * 100) + "%")

Let’s use the same classifier to make predictions over the Kaggle test set, the one we don’t know the answers to. We’ll format this as simply one prediction per line.

print("Predicting over the Kaggle test set")
test_data = np.loadtxt(test_file, delimiter=',', dtype=np.uint8)
predictions = clf.predict(test_data)

with open(prediction_output, "w") as f:
    for prediction in predictions:
        print(prediction, file=f)

The last script we’ll write takes the predictions created in the last step and formats it in the specific way Kaggle expects. This will let us see how we performed against other solutions to the What’s Cooking Challenge.

Create a new script called kaggle.py. As usual, import the required modules and define a few helpful variables.

#!/usr/bin/env python3

from __future__ import print_function
import json

predict_file = "predictions.txt"
test_file = "test.json"
output_file = "kaggle.csv"

Read the prediction file

with open(predict_file) as f:
    labels = f.readlines()
labels = [x.strip() for x in labels]

Open the Kaggle test file and parse as JSON

with open(test_file, 'r') as f:
    json_data = f.read()
obj = json.loads(json_data)

Open the output file for writing and format as the Kaggle spec requires.

with open(output_file, "w") as out:
    # Print CSV headers
    print("id,cuisine", file=out)

    i = 0
    # Iterate through each recipe in the test file
    # Follow the spec in CSV format,
    # the recipe id followed by the cuisine prediction
    for recipe in obj:
        idx = recipe["id"]
        ingredient = labels[i]
        print(str(idx) + "," + ingredient, file=out)
        i += 1

To see how well you did, submit the generated kaggle.csv file to the Kaggle competition.

The complete code is available on GitHub.

For such a naive solution, we did pretty well here — successfully classifying over 77% of the recipes. There is, of course, room for improvement. It’s unlikely you’ll top the leader board with ready-made classifiers, but it’s close enough for many real-life problems and an excellent start to a future in machine learning.

Death Cross – QuantConnect Algorithm

Death crosses are useful as trailing indicators. Specifically, a death cross occurs when the long term moving average passes above the short term moving average. The graph below depicts a death cross, highlighted in pink. It is a sign that the security is likely to fall in value.

Graph showing example of a death cross
Chart generated from bigcharts.com

Intuitively, this makes sense. The moving average is a trend over time. If the short term moving average falls below the long term moving average, it’s an indicator something has recently changed — for the worse.

Like any indicator, a death cross is far from foolproof. Since it’s a lagging indicator, if the downturn is short lived, by the time the indicator forms, the equity may have resumed an upward trend. In this instance, acting on the death cross is disadvantageous to the investor.

The opposite of a death cross is a golden cross.Β That is, a golden cross occurs if the short term moving average crosses above the long term average. A golden cross appears in the graph above in early August and is a sign of an upward trend.

Below are the results of a simple algorithm using death and golden crosses. The algorithm will go long on a golden cross and liquidate on a death cross.

Crosses really shine when used in conjunction with other indicators. The performance of crosses alone is far from groundbreaking.

Feel free to modify the algorithm on QuantConnect (GitHub). Changing the slow/fast period or symbol is a good place to start.

Have any algorithms that use crosses? A burning question I neglected to answer? Let me know in the comments!